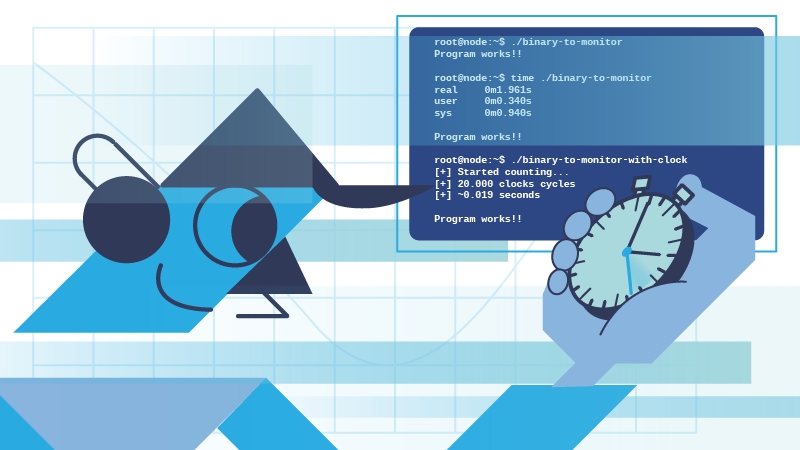
How to Measure Execution Time of a Program
Published at – 10 min read – 2041 words
Measuring the performance of a program means keeping track of the consumption of resources used by the program.
In addition to simple technical performance, such as looking closely at RAM and CPU, it is useful to monitor the execution time of a certain task. Tasks such as increasing sorting of a set of values can take a long time depending on the algorithm used.
Before delving into optimizing an algorithm, it is useful to understand how to measure the execution time of a program. In this article, I will first introduce the concept of time and then we will explore some beginner techniques for making simplistic measurements ― on the order of microseconds.
Understanding Time
Measuring the execution time of a compiled or run-time program is more difficult than you might think, since many methods are often not transferable to other platforms. Choosing the right method will depend on your operating system, programming language, and even what is meant by “time”.
Wall Time vs CPU Time
It is important to both define and differentiate between the two terms, Wall Time and CPU Time, that are often used when measuring runtime.
Wall Time, also known as “digital clock” time, is simply the total elapsed time during a measurement. It is the time you can measure with a stopwatch, assuming you are able to start and stop it at exactly the execution points you want.
CPU Time refers to the time a CPU was busy processing program instructions. Time spent waiting for other things (e.g. I/O operations) is not included in CPU time.

Wall and CPU time
Put simply, Wall Time measures how much time has passed (as if you were looking at the clock on your wall) and CPU Time is how many seconds a CPU was busy.
More often than not, System Time is preferable to CPU Time, especially in the context of parallel software. If some threads are already finished and no longer consume CPU Time, System Time provides a more natural measure of the time computation takes. We will explore System Time a bit further below.
To get good results with System Time, you will need a computer that is primarily running only the software you want to compare. The computer might still be running an operating system and some background tasks, but no GUI or any other application software. This will give you the best possible testing environment, so using System Time is the right choice.
Techniques
In the following sections, we will explore the most commonly used techniques for quantifying time-based optimization.
The Stopwatch Approach
The simplest and most intuitive way to measure time is to use a stopwatch manually from the moment you start a program. Assuming you manage to start the stopwatch and the program at the same time, the option requires the program to print a certain warning at the end of execution or at the end of a subroutine.
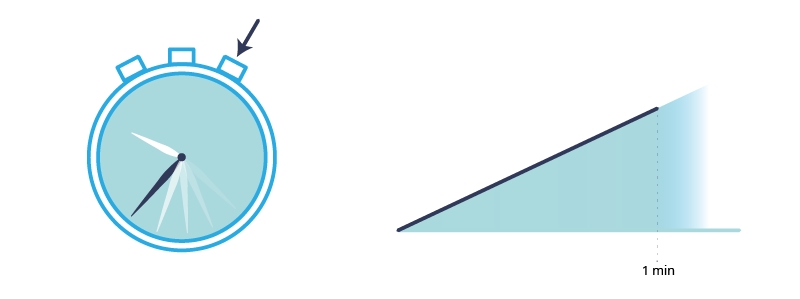
Once the button is pressed, the time increases.
This technique is not the most optimal, since on average a human takes from 0.25 seconds up to 1 full second to react and then spends another fraction of a second on pressing a button physically or digitally.
Utility Time
A faster and more automated alternative to the manual stopwatch is the time utility, which is very easy to use and requires no special settings. It is sufficient to use the following syntax time ./program-name where program-name is the name of the file or alternatively the command to execute.
Together with the result of the program, the time utility prints three different types of time:
- Real Time: Corresponds to the measurement of real time (in terms of seconds) using the system’s internal clock;
- User Time: Corresponds to the measurement of the time when the instructions of the “User” session are executed; and
- System Time: Corresponds to the measurement of the time in which the instructions of the “Supervisor” session are executed ― generally a much smaller time than the User Time when performing certain tasks.
It is not necessarily the case that User_time + System_time = Real_time. User Time and System Time are calculated in CPU-seconds(i.e. seconds calculated from the CPU clock cycle).
The reason for the difference between User Time and System Time is the result of internal mechanisms on how the execution of a process works. Generally speaking and in a very simplistic way, we can identify two separate parts within an operating system: a user part and a supervisor part (kernel mode) with higher privileges than the user.
Most of the instructions of a process are executable in user mode and do not require the necessary privileges. When you want to interact with I/O, allocate memory, or perform other operations that could interfere with the behavior of other programs, you must make system calls to the supervisor who will execute the command.
This is also called Principe of Least Privilege and is very important: in this way, the user does not have maximum privileges and is not free to do what it wants. In case of “illegal” system calls, the supervisor will just terminate the process without providing any additional information.
time command that provides similar information about time usage and possibly other resources. To access the utility itself, you may need to specify its path (/usr/bin/time).
To determine whether time is a binary or a keyword reserved within, it is useful to run type time.Counting the Clock
To execute a program correctly, it is essential that all subparts are synchronized at the right time. Physically, a computer is composed of electrical signals and if they delay or overlap, the system may not respond correctly.
The conductor responsible for synchronizing all the parts is a “universal” 1-signal called CLOCK. It is generated by a mineral (often Quartz) inside the CPU and the frequency of the signal (i.e. when it goes from 0 to 1) is determined by the CPU frequency. For example, with a 1 GHz CPU, we are talking about 10^9 times the clock signal goes from 0 to 1 in one second, so it takes about 10^-9 seconds to go from 0 to 1.
The internal components of the processor are built in such a way that they are “stressed” only at the moment the clock signal changes. If the electronic devices respond in the rising edge (i.e. when the clock goes from 0 to 1), we talk about rising-edge and falling-edge when going from 1 to 0.
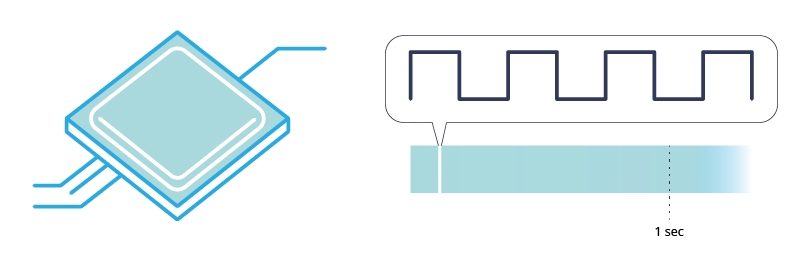
The CPU has an internal clock signal that goes from bottom (0) to up (1) in microseconds.
This being the case, it is intuitive to think that if you have the amount of clock cycles performed in a second and know the difference of clock cycles calculated between two instants, you can convert it to seconds.
To measure the execution time, you can make a measurement in two different time instants on the clock cycles passed from a certain start, like the time utility does. At that point, through finding the difference and knowing the CLOCKS_PER_SEC, you can calculate the seconds passed from the first call of clock(); to the second call. This is the result of the clock(); function.
clock_t start = clock();
// let's do some operations
clock_t end = clock();
long double seconds = (float)(end - start) / CLOCKS_PER_SEC;
The CPU time is represented by the data type clock_t, which is the number of ticks of the clock signal. By dividing the number of clock cycles by the clocks per seconds, you have the total amount of time a process has been actively using a CPU after an arbitrary event. Note that CLOCKS_PER_SEC is already defined by the compiler and it is necessary to include the time.h library.
CLOCKS_PER_SEC is not accurate to the thousandth of a second (by default the value of that variable is 1000000), so you might have a substantial difference between the value measured with clock() and the time utility.Time() Function and Epoch Time
Here, we introduce a third concept: Epoch Time. An epoch is a date and time from which a computer measures System Time. Most computer systems determine the time as a number representing the seconds removed from a particular arbitrary date and time.
For example, Unix and POSIX measure time as the number of seconds elapsed from January 1, 1970 to 00:00:00 UT ― a point in time known as the “Unix epoch”. NT Epoch Time on Windows NT and later versions refer to Windows NT System Time in intervals of (10^-7)s from 01 January 1601. You can imagine Epoch Time as year 0 of the Gregorian calendar.
You might ask, what if I need to represent a date before Epoch Time? No problem, there will only be a negative value. So, if you ever get a negative value, keep in mind that your computer does not have a problem and you do not have to change the battery of the internal clock.
The time() function implemented in time.h returns the value of time in seconds from 0 hours, 0 minutes, 0 seconds, January 1, 1970, in Greenwich Mean Time (UTC +0). If an error occurs, it returns -1.
The Unix data time_t, which represents a point in time and is (on many platforms) a signed integer traditionally 32 bits (but has expanded to 64 bits), directly encodes the Unix time number as described in the previous section. Being 32-bit means that it covers an interval of approximately 136 years in total. If you extend the data to 64 bits, it covers a range of + and - 293 billion years!
time_t begin = time(NULL);
// Call to a function that takes up time
time_t end = time(NULL);
printf("It has been %d seconds from point begin to end", (end-begin));
In this scenario, since time is in seconds, this method is often approximate if you want to measure to an accuracy of less than a thousandth of a second.
More Advanced Methods
In this article, I have described several techniques that enable you to implement a kind of internal stopwatch in your program using the built-in C libraries. However, the C API is limited and mostly for educational use. On a large project, you need to not only know how to measure, but observe in real time what’s going on at the performance level.
Why is it that when I try to access resource X, there is a spike in the CPU? How do I identify bottlenecks? In order to answer these common questions, there is a stand-alone application called “Profiler” that is very useful in tracking the performance of a program.
Profilers can analyze every single line of code. Using a profiler does not always seem well appreciated by developers, since it slows down the program almost exponentially. While most consider profilers a situational tool not meant for everyday use, code profiling can be a real boon when you need it.
In addition, profilers are useful for finding the active path in code. Figuring out what is using 20% of your code’s total CPU usage and then determining how to improve it would be a helpful example of when to use a code profiler. Lastly, profilers can assist in early detection of memory leaks, as well as understanding call performance.
Conclusion
“If you can improve something by one percent every day, over the course of a month you will improve by thirty percent.” What really makes a difference is continuous improvement over time.
What exactly does that mean? Dedicating resources to program monitoring is helpful, because even an incremental improvement can make a difference. There are countless examples of why you should adopt the strategy of measure, investigate, and fix. How I cut GTA Online loading times by 70%, 0(n^2) in CreateProcess and Don’t Copy That Surface are among my favorite articles, because each clearly shows how the process works and its effects.
In a forthcoming article, I will present a case study of an algorithm optimization and also write about some well known profilers (among all, gprof). As always, feel free to contact me on Twitter or via email.