Monitoring Your Own Infrastructure Using Grafana, InfluxDB, and CollectD
Published at – 9 min read – 1737 words

For some companies, infrastructure is the heart of its business. Specifically, I am referring to those companies which need to manage data and applications located on more than one server.
It is essential for a company to monitor its infrastructure nodes, especially if the company does not have on-site access to intervene when issues arise. In fact, the intensive use of some resources can be an indication of malfunctioning or overcrowding. However, in addition to prevention, monitoring could be used to assess possible implications of new software in the production environment. Currently, there are several “ready-to-use” solutions on the market to keep track of all the resources consumed. These solutions, which appear reasonable, present two key problems: the high price of setup and security issues related to third parties.
The first problem is related to cost. Prices vary from 10 euros per month up to thousands depending on how many hosts you need to monitor — with the former being consumer pricing and the latter being enterprise pricing. So, for example, let’s imagine that I have three nodes to monitor during the course of a year. At 10 euros per month, I would spend 120 euros. For smaller enterprises, where the price can range between 10,000 and 20,000 euro per year, such an expense can bloat its underlying cost structure and become financially untenable.
The second problem is third party risk. Typically, infrastructure data must pass through a third party company in order to be seen and analysed for the customer — whether that be an individual consumer or an enterprise. How does the third party company capture the data and then present it to the customer? Simply put, the third party company often collects data through a custom agent that is installed onto a node and monitored. Quite often is it found that this installation is not up-to-date and compatible with operating systems. Previous work has been done by security researchers who cast light upon problems with “proprietary collectors”. Would you trust them? I would not.
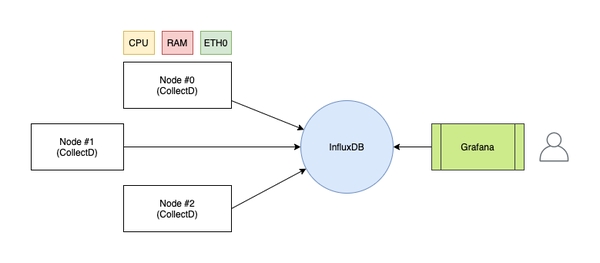
In keeping nodes for both Tor and some cryptocurrencies, I prefer to opt for a cost free, easy to configure, and open-source alternative. Here, we will use the triad: Grafana, InfluxDB, and CollectD.
Monitoring
In order to be able to analyse every metric of our infrastructure, it is necessary to use a program capable of capturing statistics on the machines we want to monitor. In this regard, CollectD comes to your aid: it is a daemon that groups and collects (hence the name) all the parameters that can be stored on disk or sent over the network.
The data will be transmitted to an instance of InfluxDB: a particular time series database that associates to each data the time (coded in UNIX timestamp) in which the server received it. In this way, the data sent by CollectD will already be set in a temporal way, as a succession of events.
Finally, you will use Grafana which will connect to InfluxDB to create flashy dashboards to display the data in a user-friendly way. Through histograms and graphs of every kind, it will be possible to observe in real time all the data related to CPU, RAM, etc.
InfluxDB

Let’s start with InfluxDB, which is the beating heart of our monitoring “system”. InfluxDB is a time series database open-source developed in Go to store data as a sequence of events.
Each time data is added, it is linked to a UNIX timestamp by default. This allows enormous flexibility for the user who no longer has to worry about saving, as an example, the “time” variable, which is sometimes cumbersome to configure. Let’s imagine we have several machines located in a number of continents. How do we manage the “time” variable? Do we use the Greenwich meridian for all the data? Or do we set a different time zone for each node? If data is saved on different time zones, how can we accurately display the graphs? As you can see, this can be very complicated.
As a time-aware database that automatically timestamps any data point, InfluxDB has the advantage of simultaneously being able to write to a certain database. This is why we often imagine InfluxDB as a timeline. Writing data does not affect the performance of the database (as sometimes happens in MySQL), since writing is simply the addition of a certain event to the timeline. The name of the program derives precisely from the conception of time as an infinite and indefinite “flow” that flows.
Installation and configuration
Another advantage of InflxuDB is the ease of installation and the extensive documentation provided by the community that widely supports the project. It has two types of interfaces: via Command Line (which is powerful and flexible for developers, but poorly prepared to see large amounts of data) and an HTTP API that allows direct communication with the database.
InfluxDB can be downloaded not only from the official website, but also from the package manager of the distribution (in this example we use a Debian system). It is advisable to check the package via GPG before installation, so (below) we import the keys of the InfluxDB package:
curl -sL https://repos.influxdata.com/influxdb.key | sudo apt-key add -
source /etc/os-release
echo "deb https://repos.influxdata.com/debian $(lsb_release -cs) stable" | sudo tee /etc/apt/sources.list.d/influxdb.list
Finally, we update and install InfluxDB:
apt-get update
apt-get install influxdb
To start it, we use systemctl:
systemctl start influxdb
To make sure that no one nefarious enters, we create the user “administrator”. InfluxDB uses a particular query language called “InfluxQL”, similar to SQL, which allows you to interact with the database. To create a new entry, we use the query CREATE USER.
influx
Connected to http://localhost:8086
InfluxDB shell version: x.y.z
>
> CREATE USER admin WITH PASSWORD 'MYPASSISCOOL' WITH ALL PRIVILEGES
From the same CLI interface, we create the “metrics” database that will be used as a container for our metrics.
> CREATE DATABASE metrics
Next, let’s modify the configuration of InfluxDB (/etc/influxdb/influxdb.conf) to have the interface open on port 24589 (UDP) with direct connection to the database named “metrics” in support of CollectD. You also need to download and place the types.db file in /usr/share/collectd/ (or any other folder) to define the data that CollectD sends in native format.
root@node#~: nano /etc/influxdb/influxdb.conf
[Collectd]
enabled = true
bind-address = ":24589"
database = "metrics"
typesdb = "/usr/share/collectd/types.db"
For further information on the CollectD block within the configuration, see the reference to documentation.
CollectD

CollectD is a data aggregator, in our monitoring infrastructure, that facilitates the transmission of data to InfluxDB. By default, CollectD captures metrics on CPU, RAM, memory (on disk), network interfaces, processes, etc. The potential of the program is endless, given that it can be extended with a preinstalled plugin enablement or through the creation of new ones.
As you can see, installing CollectD is simple:
root@node#~: apt-get install collectd collectd-utils
In a simplistic manner, let’s illustrate how CollectD works. Suppose that I want to check how many processes my node has. In doing so, CollectD does nothing more than make an API call to get the number of processes per time unit (defined as 5000 ms, by default). Once captured, the data will be sent to InfluxDB via a module (called “Network”) to be configured.
Open the file /etc/collectd/collectd.conf with our editor, scroll to find the Network section, and edit as written in the following snippet. Be sure to specify the IP where the interface of InfluxDB (INFLUXDB_IP) is located.
root@node#~: nano /etc/collectd/collectd.conf
    ...
<Plugin network>
  <Server "INFLUXDB_IP" "24589">
  </Server>
  ReportStats true
</Plugin>
    ...
My suggestion is to modify, within the configuration, the hostname that is sent to InfluxDB (which in our infrastructure is a “centralized” database, since it resides on a single node). In doing so, the data will not be redundant and there is no risk that other nodes will overwrite the information.

Grafana

A graph is worth thousand of images
In remembrance of this famous “quote”, observing the infrastructure metrics live through graphs and tables enables us to act in an efficient and timely manner. To create and configure the dashboard, we will use Grafana.
Grafana is an open-source tool, compatible with a wide range of databases (including InfluxDB), that presents a graphical representation of metrics and allows a user to create alerts if a particular piece of data meets a condition. For example, if your CPU reaches high peaks, you can be notified on Slack, Mattermost, by email, etc. In fact, I have personally configured an alert every time someone enters SSH, so I can actively monitor who “enters” my infrastructure.
Grafana does not require any special settings: once again, it is InfluxDB that “scans” the “time” variable. The integration is simple. Let’s start by import the public key to add the package from the Grafana official website (it depends on the OS you are using):
root@node#~: wget -q -O - https://packages.grafana.com/gpg.key | sudo apt-key add -
root@node#~: echo "deb https://packages.grafana.com/oss/deb stable main" | sudo tee -a /etc/apt/sources.list.d/grafana.list
root@node#~: apt-get update && apt-get install grafana
Let’s start it through systemctl:
root@node#~: systemctl start grafana-server
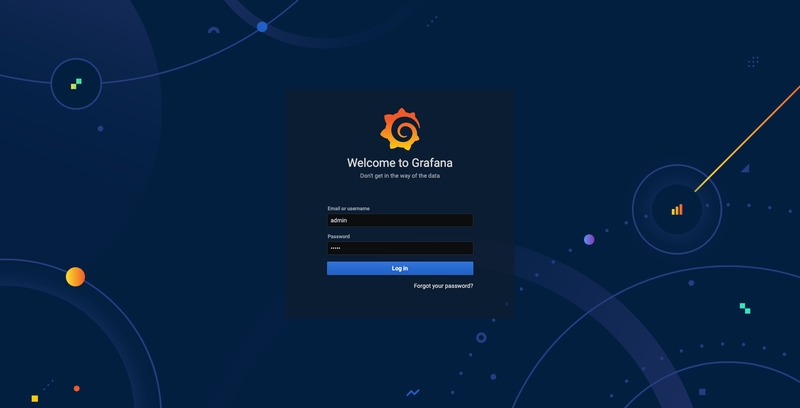
Next, as we go to the localhost:3000 page through the browser, we should be presented with a login interface for Grafana. By default, you should use admin as username and admin as password (it is advisable to change the password after the first login).
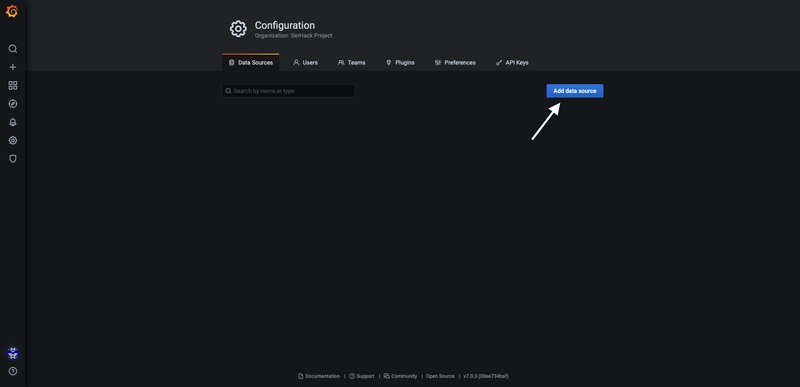
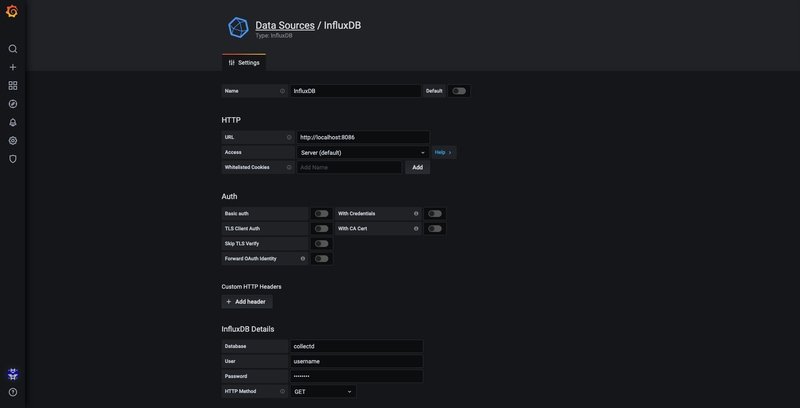
Let’s go to Sources and add our Influx database:
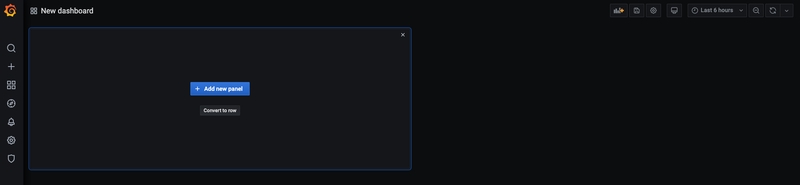
The screen now shows a small green rectangle just below the New Dashboard. Hover your mouse over this rectangle and select Add Panel, then Graph:
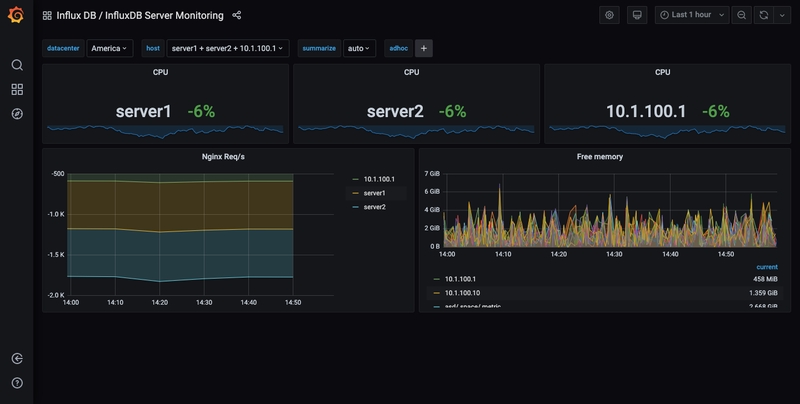
A graph with the test data is now shown. Click on the title of this chart and choose Edit. Grafana allows the writing of intelligent queries: you do not have to know every field of the database, as Grafana proposes them through a list from which you can choose the parameter to analyse.
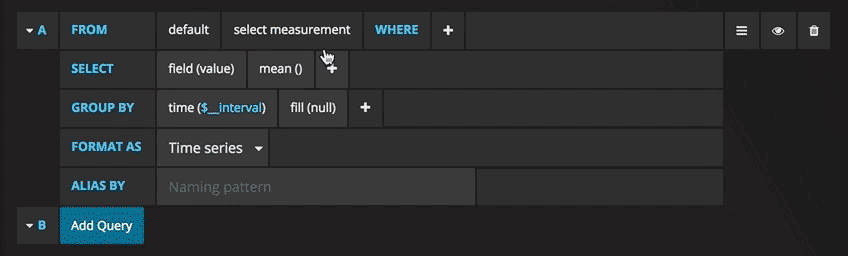
Writing queries has never been easier: just select the measurement you would like to trace and click Refresh. I also recommend differentiating the metrics by hostname, so it is easier to isolate any problems. If you are looking for other ideas for creating dashboards, I recommend visiting Grafana showcase for inspiration.
As we have noticed, Grafana is very extensible and allows us to compare data of different nature. There is no metric that cannot be captured, so creativity is your only limit. Monitor your machine and get a universal, live view of your infrastructure!